Bat Ray Weight
- Thread starter Ken Jones
- Start date
There is a problem with the model used to generate the tables. It assumes an exponential increase in weight. While the model might be a reasonably good fit for limited wingspans, as the ray gets larger, the weights get unrealistic. If you have a 3D object, like a brick with dimensions, LxWxH, and a density,d, then its weight would be LxWxHxd. A similar brick in which each of the dimensions is doubled, would have a weight:
If objects are similar (all dimensions changing proportionally), the weight should change by the cube of the proportional change in any linear. A model for this is W=aL³, where a is a constant that relates the weight to the length. This is true of fish, as well as bricks, but not all fish grow proportionally. Some may be heavier, some thinner, but a good starting point for a model is assuming it is of the form: W=aL^b (weight = a times length to the power of b)
,
Using the data listed in your article, I made two tables in an online calculator called Desmos. The first used all the data, the second omitted two points that looked like outliers. I used Northern Boy's numbers to plot his first two models (exponential). Desmos regression feature allowed me to Generate exponential and monomial models from each of the tables. As a target I plotted the maximum wingspan versus the maximum weight (72 in, 240 lb) listed in Milton Love's Certainly More Than You Want to Know About the Fishes of the Pacific Coast. These values may not be from the same ray, but I thought it should provide some idea.
The Desmos plot can be found at: https://www.desmos.com/calculator/jxg4yhaim4
Each curve has a colored circle at the left of its input line that corresponds to the color of the curve. For example, the curves of Northern Boys models are green and blue. Clicking on the circles toggles the curves off and on, which can be helpful to decrease clutter. You can see that all four exponential models (green, blue, red and purple) seem reasonable while the wingspans (S) are small, but they take off rapidly. The monmial model from the complete data set (orange) ends up very close to the target point (237.9 lb at 72 in), but the correlation coefficient is only 0.91. The second monomial model has a much better coefficient, R²=0.959, but it falls a bit short of the target: (234.9 lb at 72 in). The difference between the two curves is much less than any expected difference between the weights of rays with the same span.
Note the exponents for the two models (2.92283 and 2.85032) are both close to but slightly under 3. This suggest that bat rays are nearly similar (big rays being scaled up versions of small ones), though the wings (pectoral fins) may grow slightly faster than the rest of the body.
I am working a table that I will post later.
Steve
2Lx2Wx2Hxd=2x2x2xLxWxHxd=2³(LxWxHxd)
If objects are similar (all dimensions changing proportionally), the weight should change by the cube of the proportional change in any linear. A model for this is W=aL³, where a is a constant that relates the weight to the length. This is true of fish, as well as bricks, but not all fish grow proportionally. Some may be heavier, some thinner, but a good starting point for a model is assuming it is of the form: W=aL^b (weight = a times length to the power of b)
,
Using the data listed in your article, I made two tables in an online calculator called Desmos. The first used all the data, the second omitted two points that looked like outliers. I used Northern Boy's numbers to plot his first two models (exponential). Desmos regression feature allowed me to Generate exponential and monomial models from each of the tables. As a target I plotted the maximum wingspan versus the maximum weight (72 in, 240 lb) listed in Milton Love's Certainly More Than You Want to Know About the Fishes of the Pacific Coast. These values may not be from the same ray, but I thought it should provide some idea.
The Desmos plot can be found at: https://www.desmos.com/calculator/jxg4yhaim4
Each curve has a colored circle at the left of its input line that corresponds to the color of the curve. For example, the curves of Northern Boys models are green and blue. Clicking on the circles toggles the curves off and on, which can be helpful to decrease clutter. You can see that all four exponential models (green, blue, red and purple) seem reasonable while the wingspans (S) are small, but they take off rapidly. The monmial model from the complete data set (orange) ends up very close to the target point (237.9 lb at 72 in), but the correlation coefficient is only 0.91. The second monomial model has a much better coefficient, R²=0.959, but it falls a bit short of the target: (234.9 lb at 72 in). The difference between the two curves is much less than any expected difference between the weights of rays with the same span.
Note the exponents for the two models (2.92283 and 2.85032) are both close to but slightly under 3. This suggest that bat rays are nearly similar (big rays being scaled up versions of small ones), though the wings (pectoral fins) may grow slightly faster than the rest of the body.
I am working a table that I will post later.
Steve
Last edited:
To be honest you lost me somewhere along the post, my brother was the smart one with the PhD, I only have a MS and it was in Education, a field that didn't require much math. Heck, I can remember struggling with statistics. But I am looking forward to your table and seeing the differences.
I have to apologize to Northern Boy. I missed one very important data point: the 54.25", 203 lb. bat ray in the picture. Including that ray changes the models significantly:https://www.desmos.com/calculator/ebtffeyem2
Please follow the link above, and feel free to play with the graph, by turning on and off curves and data sets, or even adding or subtracting data. Note that the exponential models (green, blue and red) fit the data pretty well, while the monomial model drops below the early data point in order to turn up high enough later.
I think that if the numbers for the Stearn's Wharf ray are correct, it is probably an exceptional fish. The exponential models work, because they turn up very fast. The problem comes when you extend the data. According to Love, bat rays can get up to 6 ft, though Miller and Lea say 4 ft. At 6 ft. the exponential models give us rays over 1000 lb. If you scaled it up to the width of a manta ray (276 in), you would have a 800,000,000,000 lb bat ray.
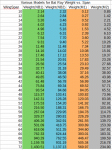
Here is the table (the models are color coded to match the curves of the graph):
We really need more data on big rays (as Northern Boy suggested), but I would still think that the gray model may be closest to what you might expect.